Hints
This page provides some quick sources of information on lab equipment and advice on how to do particular jobs in the lab. If you've pulled together a cheat sheet of any type that you think your colleagues would find useful, send it in and we'll consider it for inclusion here.
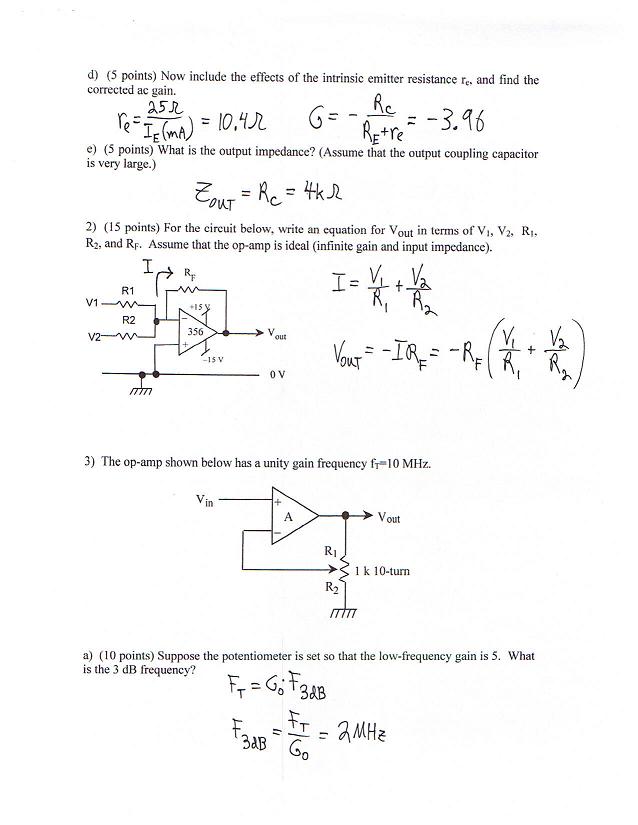
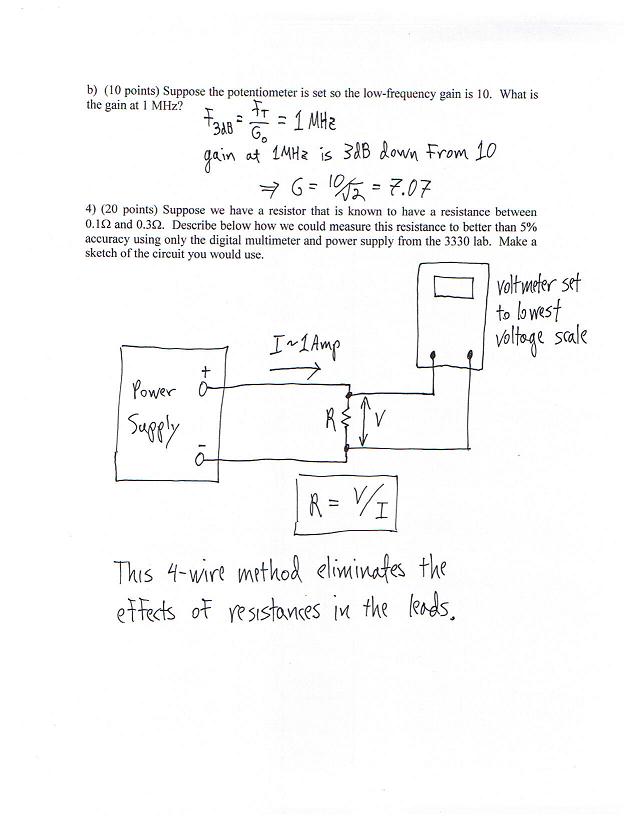
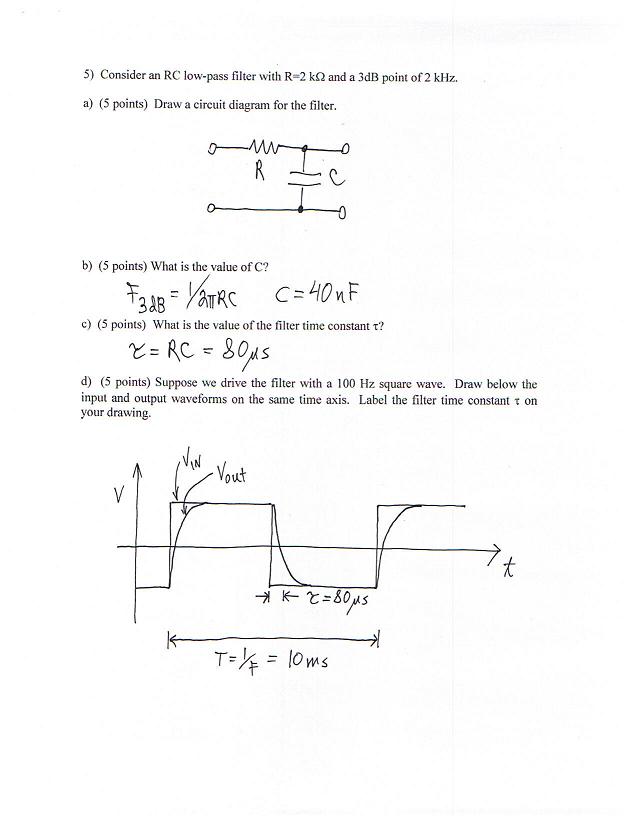
An old midterm exam p1, p2, p3, p4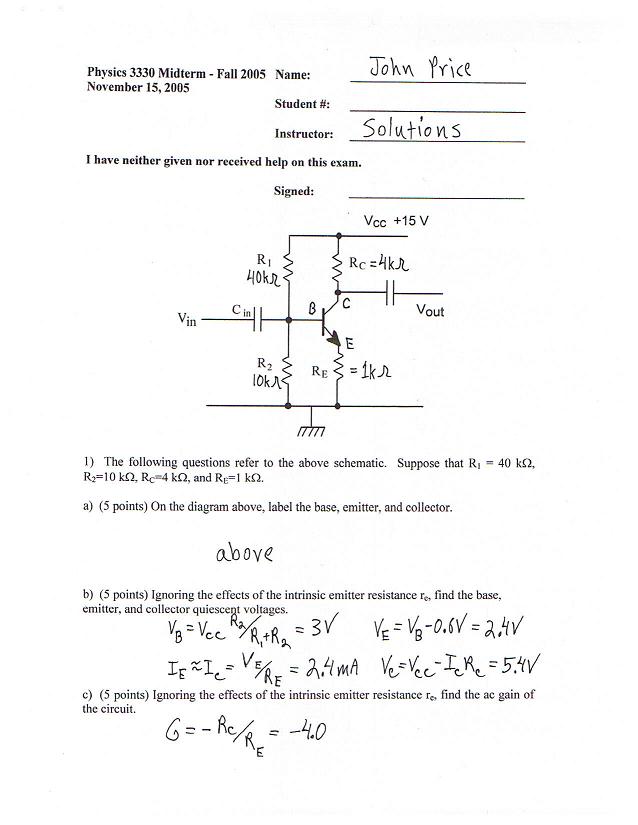
Trouble Shooting No really, this will solve 90% of your problems in the lab.
Using the Department of Physics Scanners
Getting data off the TDS3014B Scopes
Getting data off the Rigol Scopes
SR510 Lock-in amplifier instructions
Some useful items on data plotting and analysis
- Mathematica 1. Using Mathematica as a calculator, reading data sets into tables, plotting data, etc.
- Mathematica 2. Using Mathematica for plotting and fitting your data sets to theory. This activity asks you to download your own data from the scopes, with instructions specifically for the Rigol scopes used in the Advanced Lab. You can download data from your TDS 3014B scopes by following the instructions under the Hints tab. Downloading data is a very useful skill. However, if you are really stuck, here is a set of oscilloscope data that you can use in the activity: scope_sample_data.txt
- Ben Zwickl's Mathematica notebook for plotting data NOW.
- Plotting data with error bars. Log plotting with error bars is covered in the next example:
- Using Mathematica to fit your data. Also here is the data file used by the notebook (courtesy of Brian McDonald!).
- Ploting data and theory together with Mathematica in your Lab Reports.